分析技术研习室
课题组每周研讨会
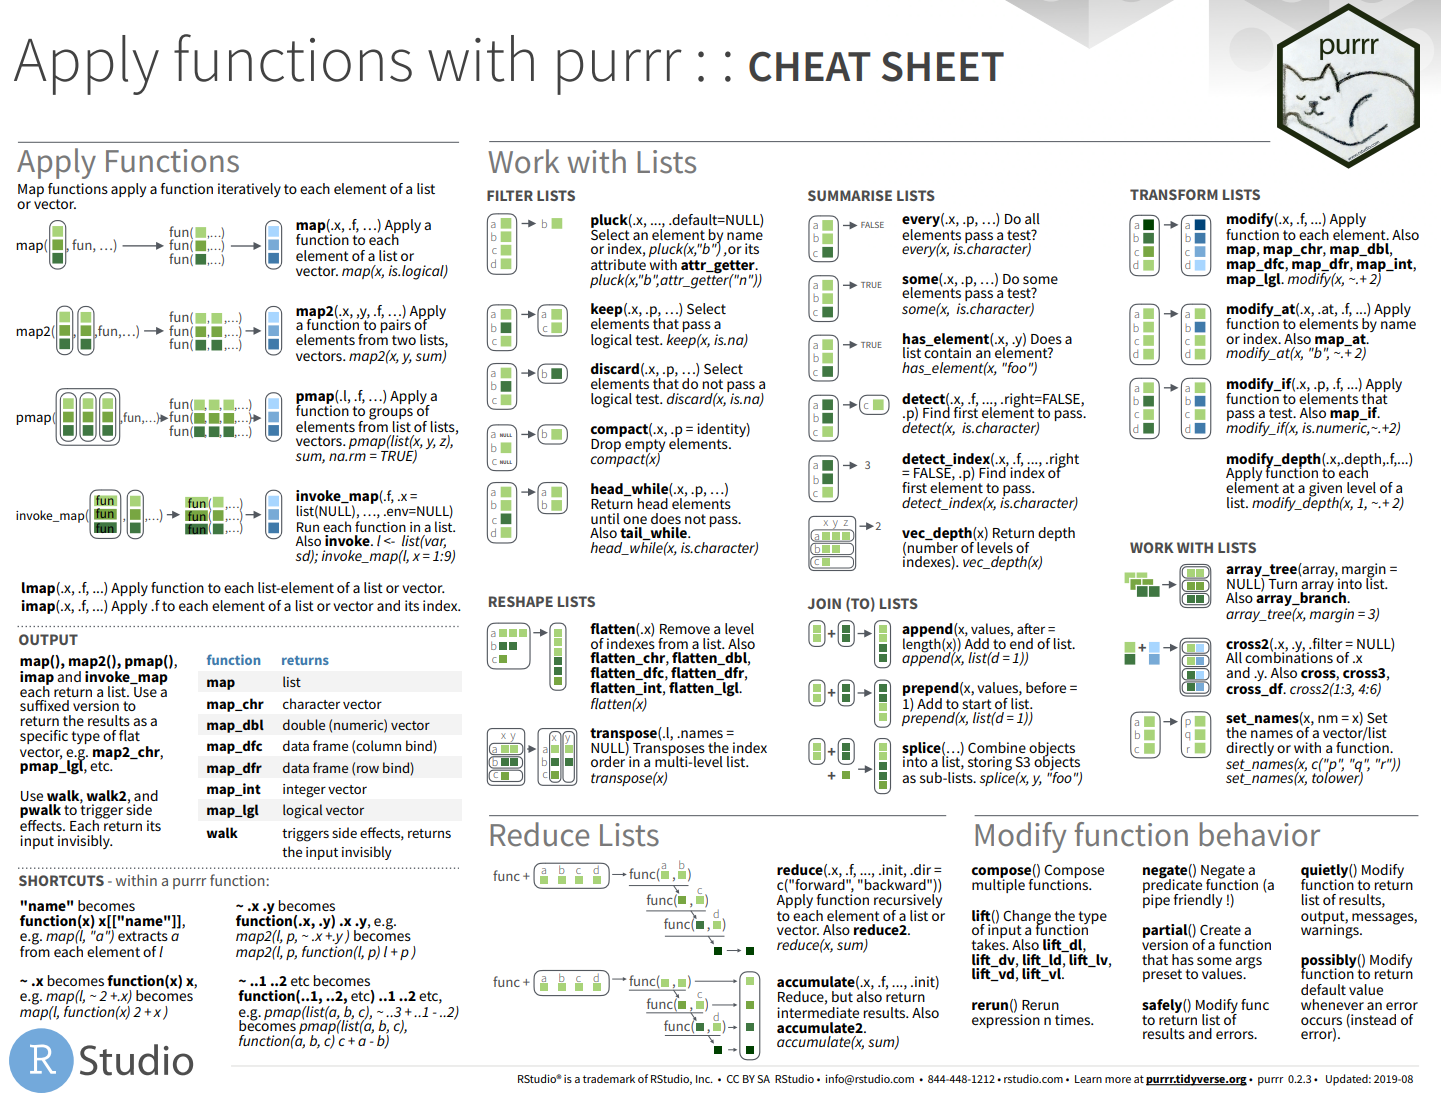
map函数
以map开头的一系列函数接受向量为输入,对向量的每个元素进行函数运算,再返回一个新的向量,这个新的向量的长度和原来的一样长,向量元素的名称也是一样的;输出向量的类型由map函数的后缀来表明:
map()makes a list.map_lgl()makes a logical vector.map_int()makes an integer vector.map_dbl()makes a double vector.map_chr()makes a character vector.
map*函数第一个参数是输入的向量,第二个是进行操作的函数,第三个是该函数的其他参数
df <- data.frame(x=rnorm(1:10),
                 y=rnorm(1:10))
df %>% map_dbl(mean,trim=0.5)

         x          y
-0.1016901 -0.1113656
还有一些简便的操作:比如想要对某个分类变量的所有类进行分别拟合模型
models <- mtcars %>%
  split(.$cyl) %>%
  map(function(df) lm(mpg ~ wt, data = df))

##匿名函数也可以写成单侧的公式的形式
models <- mtcars %>%
  split(.$cyl) %>%
  map(~lm(mpg ~ wt, data = .))
##另一个例子:计算每列中unique的元素的个数
map_int(iris, function(x) length(unique(x)))
#> Sepal.Length  Sepal.Width Petal.Length  Petal.Width      Species
#>           35           23           43           22            3
map_int(iris, ~length(unique(.x)))
#> Sepal.Length  Sepal.Width Petal.Length  Petal.Width      Species
#>           35           23           43           22            3
又比如现在要对这些结果进行汇总,并得到R^2^,:
models %>%
  map(summary) %>%
  map_dbl(~.$r.squared)
#>         4         6         8
#> 0.5086326 0.4645102 0.4229655

##也可以直接使用字符形式
models %>%
  map(summary) %>%
  map_dbl("r.squared")
#>         4         6         8
#> 0.5086326 0.4645102 0.4229655
也可以使用map函数以数字作为参数来按位置选取元素:
x <- list(list(1, 2, 3), list(4, 5, 6), list(7, 8, 9))
x %>% map_dbl(2)
#> [1] 2 5 8

##相当于
x %>% map_dbl(function(x){x[[2]]})
x %>% map_dbl(~.[[2]])
同样可以按照名称来选择:
t <- list(x=c("a"=1,"b"=2),y=c("a"=4,"b"=7))
t
t %>% map("a")

#$x
#[1] 1

#$y
#[1] 4
Mapping over multiple arguments
到目前为止,我们循环的变量只有一个,但是更常见的情况是对多个变量同时进行循环运算,这个时候就需要使用map()和pmap()函数了
比如现在想要使用正态分布来生成一些随机数,但是每次需要改变正态分布的均值和标准差参数:
##如果使用map可以:
seq_along(mean) %>%
  map(.,function(x){
    rnorm(5,mean[x],sigma[x])
  })

###也可以写成公式的形式
seq_along(mean) %>%
  map(~rnorm(5,mean[.],sigma[.]))

# [[1]]
# [1] 5.331848 4.152430 4.705269 4.305054 6.001070
#
# [[2]]
# [1]  4.884701 11.393424 18.609389  8.543107  9.342536
#
# [[3]]
# [1] -8.480736  4.123057  9.274597  1.989373  6.618539

##使用map2就更简单
map2(mean, sigma, rnorm, n = 5)
map2函数的用法就是map2(.x, .y, .f, ...),前两个是要输入的参数,第三个是要循环运算的函数,最后还可以加一些该函数的其他参数
当我们有大于2个参数需要循环的时候就需要使用pmap()函数,该函数可以接受由参数构成的列表
比如现在将上面生成随机数的数量n也作为循环的参数输入:
n <- c(1,3,5)
args <- list(n=n,mean=mean,sd=sigma)
args %>%
  pmap(rnorm)
# [[1]]
# [1] 6.037321
#
# [[2]]
# [1] 16.130696  7.958435 14.668535
#
# [[3]]
# [1]   4.2699221  -0.8454603   0.3408550 -16.9941376  15.3336642
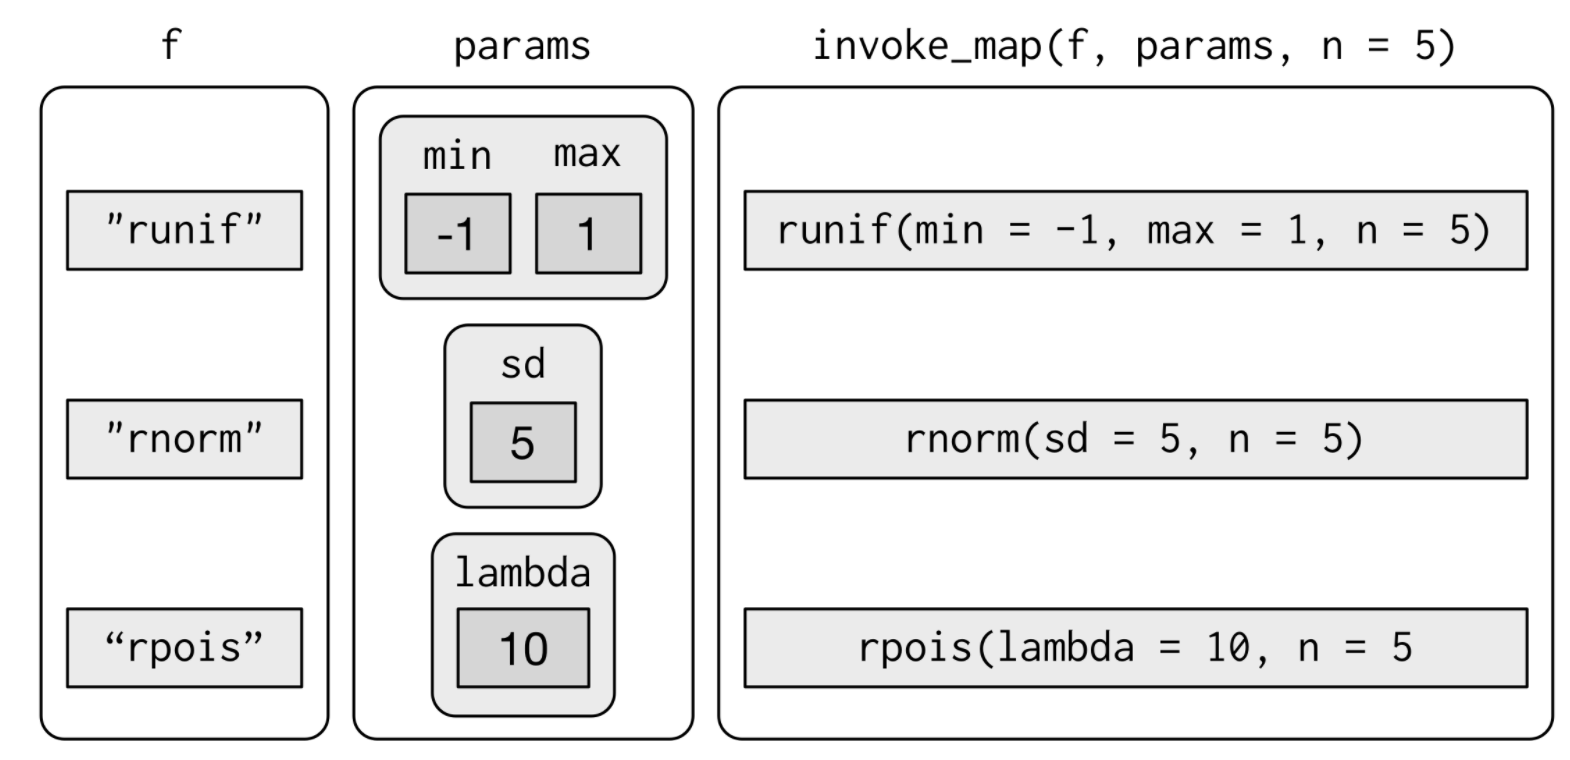
Invoking different functions
除了改变参数之外,我们还可以改变需要循环的函数,使用invoke_map()函数:
f <- c("runif", "rnorm", "rpois")
param <- list(
  list(min = -1, max = 1),
  list(sd = 5),
  list(lambda = 10)
)
invoke_map(f, param, n = 5)
# [[1]]
# [1]  0.4389858 -0.1890459 -0.8171555  0.8873060  0.8350870
#
# [[2]]
# [1]  5.71620221  0.02232882 -1.85799274 -1.91638366 -1.86849356
#
# [[3]]
# [1]  6 11  9  7 11

###也可以使用相同的参数
invoke_map(list(runif, rnorm), list(list(n = 5)))
# [[1]]
# [1] 0.2249688 0.7372143 1.1147632 1.4475145 0.1239864
#
# [[2]]
# [1] -1.3756928  0.5784743 -1.0652471 -0.3738639  0.1081697
#
# [[3]]
# [1] 14  6  9 14 18
第一个参数就是函数构成的列表,或者是函数名构成的字符向量;第二个参数是一个列表,每个元素都是一个参数列表,位置和输入的函数相对应:
Other patterns of for loops
Predicate functions
这些函数对输入值进行判断,返回值是TRUE或者FALSE
keep和discard会对输入值的每个元素进行判断,分别保留TRUE和FALSE的元素:
iris %>%
  keep(is.factor) %>%
  str()
#> 'data.frame':    150 obs. of  1 variable:
#>  $ Species: Factor w/ 3 levels "setosa","versicolor",..: 1 1 1 1 1 1 1 1 1 1 ...

iris %>%
  discard(is.factor) %>%
  str()
#> 'data.frame':    150 obs. of  4 variables:
#>  $ Sepal.Length: num  5.1 4.9 4.7 4.6 5 5.4 4.6 5 4.4 4.9 ...
#>  $ Sepal.Width : num  3.5 3 3.2 3.1 3.6 3.9 3.4 3.4 2.9 3.1 ...
#>  $ Petal.Length: num  1.4 1.4 1.3 1.5 1.4 1.7 1.4 1.5 1.4 1.5 ...
#>  $ Petal.Width : num  0.2 0.2 0.2 0.2 0.2 0.4 0.3 0.2 0.2 0.1 ...
some和every判断输入值的元素是否至少有一个是TRUE还是全部是TRUE:
x <- list(c(1:5), c("x","y"))

x %>%
  some(is_character)
#> [1] TRUE

x %>%
  every(is_vector)
#> [1] TRUE
detect寻找第一个判断是TRUE的元素,detect_index返回该元素的位置:
x <- c("a","b","c")
x %>%
  detect(~.=="a")
#[1] "a"
x %>%
  detect_index(~.=="a")
#[1] 1
head_while()和tail_while从前面和后面取满足条件的元素:
x <- sample(10)
x
# [1]  4  3  7 10  5  1  2  8  9  6
x %>%
  head_while(~.>2)
#[1]  4  3  7 10  5
x %>%
  tail_while(~.<8)
#[1] 6
has_element()检测输入向量是否含有某个元素:
has_element(c(1,2,3),1)
#[1] TRUE
compact()丢掉空的元素:
x <- c(1,2,NULL)
x %>%
  compact()
#[1] 1 2
Reduce and accumulate
reduce函数的输入是一个二元的函数,也就是有两个输入参数的函数,然后将我们输入的列表迭代的输入进这个函数,直到最后只有一个元素为止:
##取交集
vs <- list(
  c(1, 3, 5, 6, 10),
  c(1, 2, 3, 7, 8, 10),
  c(1, 2, 3, 4, 8, 9, 10)
)

vs %>% reduce(intersect)
#> [1]  1  3 10

###求和
reduce(c(1,2,3,4),`+`)
#[1] 10

###融合多个数据框
dfs <- list(
  age = tibble(name = "John", age = 30),
  sex = tibble(name = c("John", "Mary"), sex = c("M", "F")),
  trt = tibble(name = "Mary", treatment = "A")
)

dfs %>% reduce(full_join)
#> Joining, by = "name"
#> Joining, by = "name"
#> # A tibble: 2 x 4
#>   name    age sex   treatment
#>   <chr> <dbl> <chr> <chr>
#> 1 John     30 M     <NA>
#> 2 Mary     NA F     A
accumulate和reduce类似,但是保留了中间的结果:
accumulate(c(1,2,3,4),`+`)
##[1]  1  3  6 10
Dealing with failure
当我们进行循环的时候,可能中间会出现某些错误,我们不想要这些错误破坏整个的循环过程,所以需要捕获错误信息
可以使用safely()函数,该函数输入是一个函数,返回一个修饰的版本,这个修饰的版本运行的时候不会报错,而是返回两个元素的列表(results 和 error):
result:原始的结果,如果有错误就是NULLerror:报错的信息,如果没有报错就是NULL
另一个函数是possibly,输入有两个参数,第一个是我们要运行的函数,第二个参数是otherwise,可以用来指定报错返回的内容,输出也是一个对原来的函数修饰的版本
现在以一个线性回归的例子来展示这两个函数的用法:
##生成数据
dat = structure(list(group = c("a", "a", "a", "a", "a", "a", "b", "b", "b"),
                     x = c("A", "A", "A", "B", "B", "B", "A", "A", "A"),
                     y = c(10.9, 11.1, 10.5, 9.7, 10.5, 10.9, 13, 9.9, 10.3)),
                class = "data.frame",
                row.names = c(NA, -9L))
dat
# group x    y
# 1     a A 10.9
# 2     a A 11.1
# 3     a A 10.5
# 4     a B  9.7
# 5     a B 10.5
# 6     a B 10.9
# 7     b A 13.0
# 8     b A  9.9
# 9     b A 10.3
现在要按照group来分别拟合线性回归模型:
dat %>%
  split(.$group) %>%
  map(~lm(y~x,data = .))
# Error in `contrasts<-`(`*tmp*`, value = contr.funs[1 + isOF[nn]]) :
#   contrasts can be applied only to factors with 2 or more levels
这里就可以使用poossibly来指定错误发生时返回的信息(使用otherwise参数):
posslm <- possibly(.f = lm, otherwise = NULL)##返回一个修饰的函数

dat %>%
  split(.$group) %>%
  map(~posslm(y~x,data = .)) -> mod
mod
# $a
#
# Call:
#   .f(formula = ..1, data = ..2)
#
# Coefficients:
#   (Intercept)           xB
# 10.8333      -0.4667
#
#
# $b
# NULL
然后就可以使用刚才讲过的keep函数来找到发生错误的元素:
mod %>%
  keep(~is.null(.x) ) %>%
  names()
#[1] "b"
也可以使用compact去掉空的元素:
filter_mod <- mod %>%
  compact()
filter_mod
# $a
#
# Call:
#   .f(formula = ..1, data = ..2)
#
# Coefficients:
#(Intercept)       xB
#   10.8333      -0.4667
safely返回的每个元素都是一个列表,有两个元素:
safelm = safely(.f = lm)

dat %>%
  split(.$group) %>%
  map(~safelm(y~x,data = .)) -> mod2
mod2
# $a
# $a$result
#
# Call:
#   .f(formula = ..1, data = ..2)
#
# Coefficients:
#   (Intercept)           xB
# 10.8333      -0.4667
#
#
# $a$error
# NULL
#
#
# $b
# $b$result
# NULL
#
# $b$error
# <simpleError in `contrasts<-`(`*tmp*`, value = contr.funs[1 + isOF[nn]]): contrasts can be applied only to factors with 2 or more levels>
#
可以使用transpose()来把结果和错误进行聚合:
mod2_tidy <- mod2 %>%
  transpose()
mod2_tidy
# $result
# $result$a
#
# Call:
#   .f(formula = ..1, data = ..2)
#
# Coefficients:
#   (Intercept)           xB
# 10.8333      -0.4667
#
#
# $result$b
# NULL
#
#
# $error
# $error$a
# NULL
#
# $error$b
# <simpleError in `contrasts<-`(`*tmp*`, value = contr.funs[1 + isOF[nn]]): contrasts can be applied only to factors with 2 or more levels>
还有一个函数,quietly(),和safely类似,不过捕获的不是error而是打印的输出,信息和警告;每个元素是一个列表含有4个元素(result,output,warnings,messages):
x <- list(1, -1)
x %>% map(quietly(log))
# [[1]]
# [[1]]$result
# [1] 0
#
# [[1]]$output
# [1] ""
#
# [[1]]$warnings
# character(0)
#
# [[1]]$messages
# character(0)
#
#
# [[2]]
# [[2]]$result
# [1] NaN
#
# [[2]]$output
# [1] ""
#
# [[2]]$warnings
# [1] "NaNs produced"
#
# [[2]]$messages
# character(0)
Others
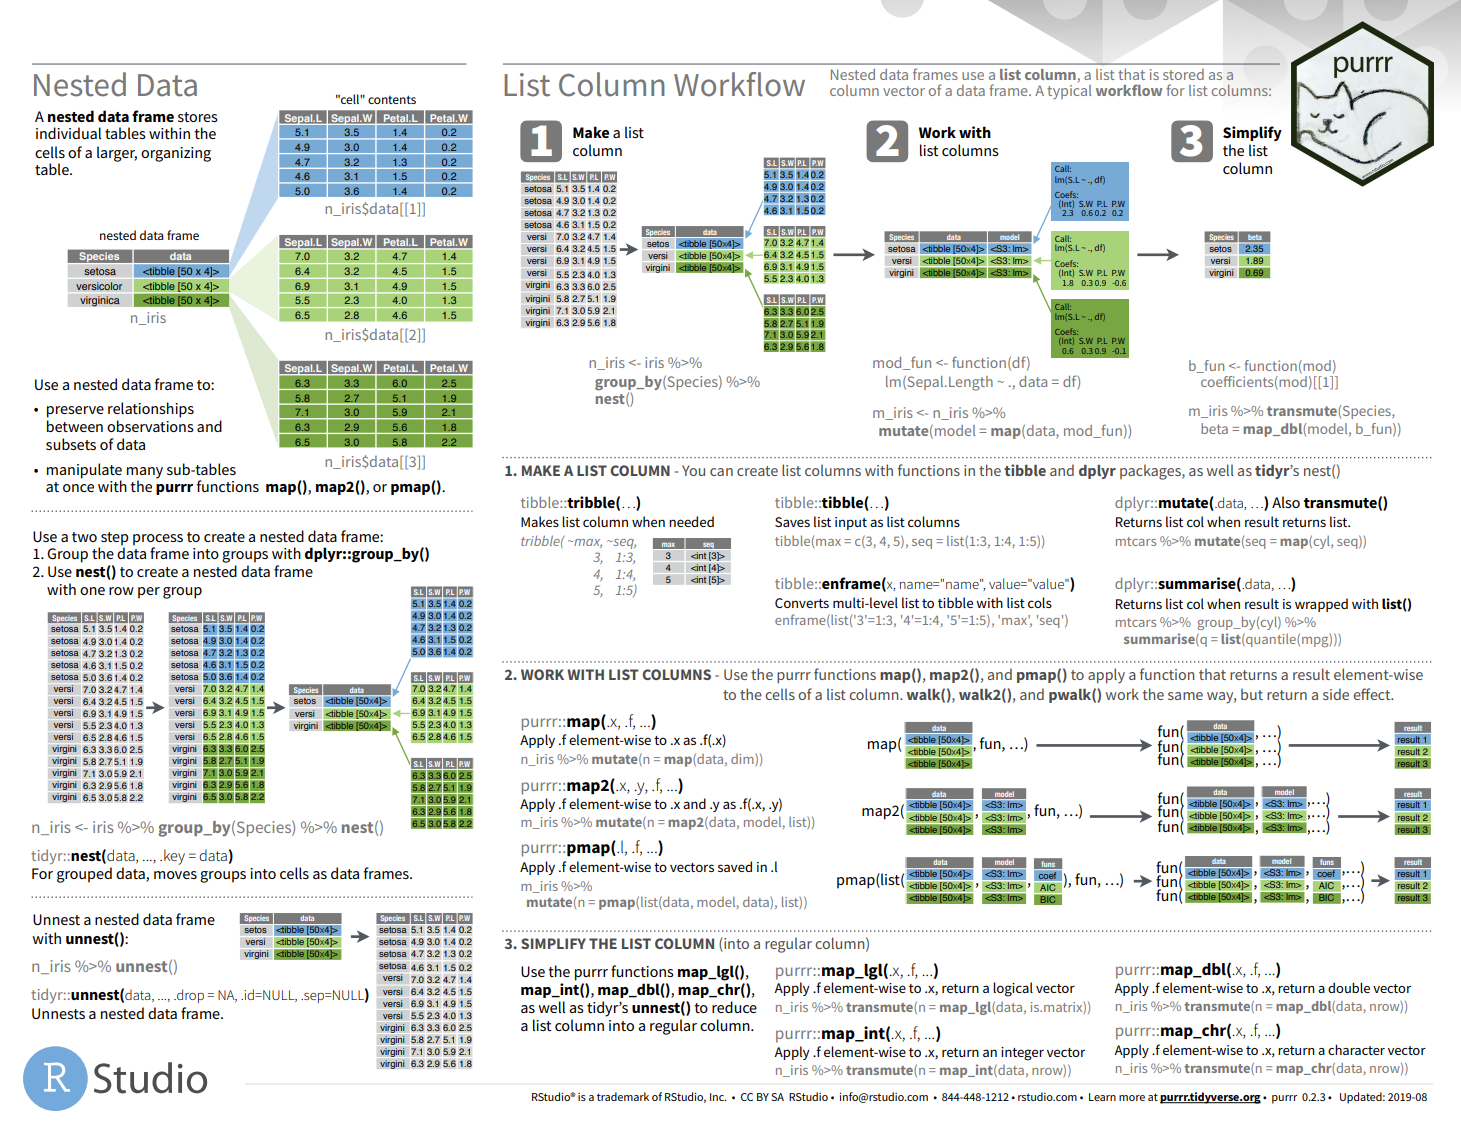
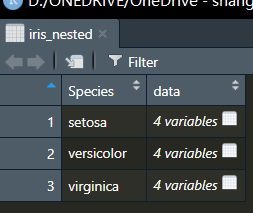
Creating Nested Data Frames
将多个数据框存到一个大的数据框里面:
iris_nested <- iris %>%
  group_by(Species) %>%
  nest()
Reshaping Lists
主要有两个函数:以flatten()开头的一系列函数和transpose函数
flatten_**函数的作用是将list”压平”,也就是将list的层级结构给去了:
- flatten_lgl() returns a logical vector
- flatten_int() returns an integer vector
- flatten_dbl() returns a double vector
- flatten_chr() returns a character vector
- flatten_dfr() returns a data frames created by row-binding
- flatten_dfc() returns a data frames created by column-binding
x <- rerun(2, sample(6))
x
# [[1]]
# [1] 4 2 5 3 1 6
#
# [[2]]
# [1] 1 3 2 5 4 6
flatten_int(x)
#4 2 5 3 1 6 1 3 2 5 4 6
这个函数和unlist类似,但更加安全,因为如果列表中类型不匹配的话这个函数就会报错,而unlist不会:
a <- list(c(1,2,3),c("x","y"))
unlist(a)
#[1] "1" "2" "3" "x" "y"
flatten_dbl(a)
#错误: Can't coerce element 4 from a character to a double
第二个函数是transpose,这个函数将多个列表转化成列表对:
x <- rerun(2, x = runif(1), y = runif(3))
x
[[1]]
[[1]]$x
[1] 0.956008

[[1]]$y
[1] 0.4784622 0.7901005 0.7429528


[[2]]
[[2]]$x
[1] 0.8055662

[[2]]$y
[1] 0.3681470 0.9886638 0.7591404


x %>% transpose() %>% str()
List of 2
 $ x:List of 2
  ..$ : num 0.956
  ..$ : num 0.806
 $ y:List of 2
  ..$ : num [1:3] 0.478 0.79 0.743
  ..$ : num [1:3] 0.368 0.989 0.759